3 clues about what's next for the S&P 500 after weeks of tariff-fueled selling

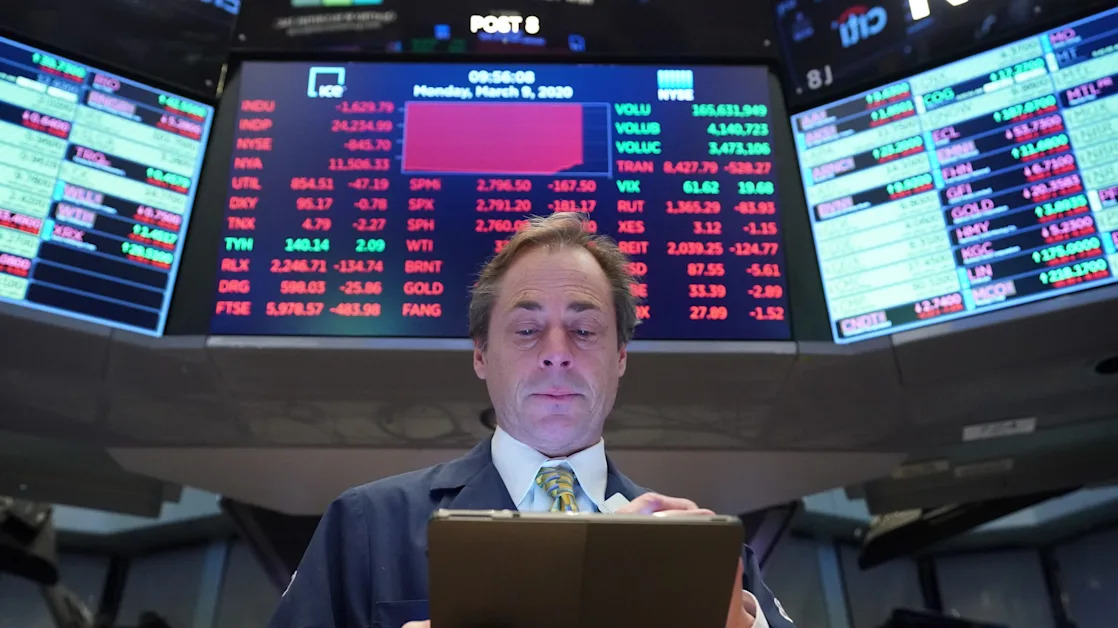
There's a lot of noise in the stock market right now.
From the trade tariffs to President Donald Trump threatening to fire Federal Reserve Chairman Jerome Powell, investors are grappling with sky-high uncertainty that could fuel an economic downturn .
This noise has resulted in considerable volatility. After hitting a record high in January, the S&P 500 declined nearly 20% before rallying. On Monday, the index fell more than 2% , but has rebounded roughly the same amount today.
Here's a summary of key indexes as of 12:05 p.m. in New York:
During periods of significant uncertainty, technical analysis can be useful for investors, helping them cut through the noise and get a clear road map of the stock market's future direction.
"A multi-front trade war is by itself a lot for stocks to handle, so adding a Fed independence crisis on top of it has markets understandably jittery," said Jeff Buchbinder, chief equity strategist for LPL Financial, said.
So, what does the chart say?
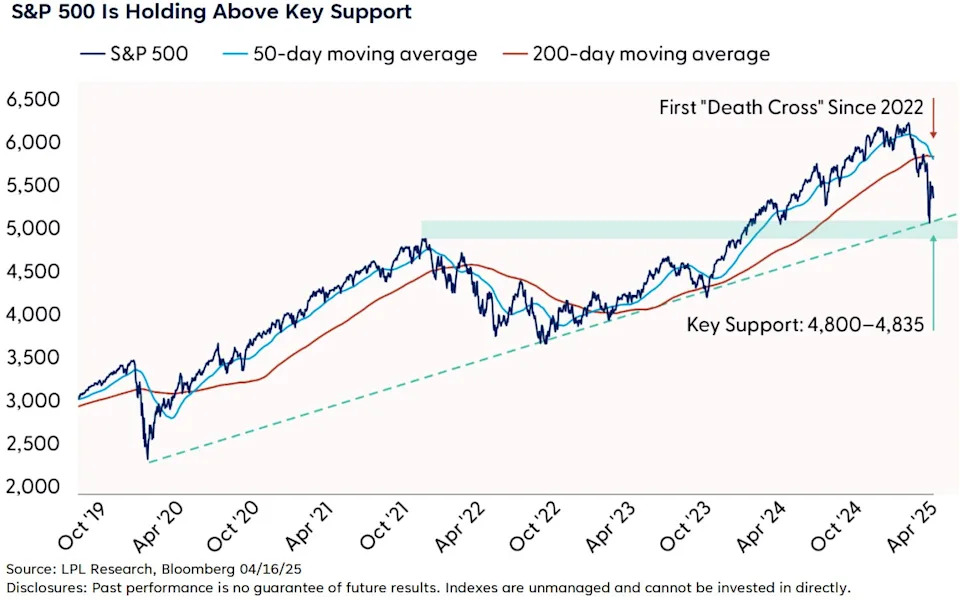
1. The long-term uptrend is intact
The first big takeaway from the S&P 500 chart is that even after the S&P 500's 16% decline, the long-term uptrend "remains intact," evidenced by the index bouncing off of rising trend-line support defined by the lows of March 2020 and October 2022.
"This suggests the path of least resistance from here is likely higher, but not without near-term risks," LPL Research said.
2. The capitulation event probably happened
The intense selling in the stock market earlier this month likely marked a capitulation event, suggesting that the index's decline to around 4,835 could mark "the low" of this current sell-off.
Strengthening that case is the fact that the low occurred at two levels of support that converged: at the horizontal support line market by the S&P 500's peak in January 2022 and the rising diagonal trend line that began in March 2020.
"Several items on our checklist for a durable low were checked, including historically oversold conditions at the index and constituent level, washed-out readings across market breadth measures, peak fear likely being reached, and record-level trading volume," LPL Research said.