Watch These Palantir Levels as Stock Continues Recent Recovery After NATO Deal

Key Takeaways
Palantir Technologies ( PLTR ) shares jumped nearly 5% Monday to extend last week’s recovery effort following news that NATO had acquired the analytics software provider’s AI-enabled military system .
The deal with Brussels-based NATO helps ease investor concerns that Europe may rely less on American defense contractors such as Palantir amid an uncertain trade outlook after the Trump administration earlier this month unveiled widespread "reciprocal" tariffs , which have since been temporarily paused .
Palantir shares have gained 22% since the start of the year through Monday’s close but have lost around a quarter of their value since hitting their record high in mid-February, amid uncertainty surrounding military spending with a federal push for government efficiency.
Below, we take a closer look at Palantir’s weekly chart and use technical analysis to identify key price levels worth watching out for.
Bullish Engulfing Pattern Signals Shift in Sentiment
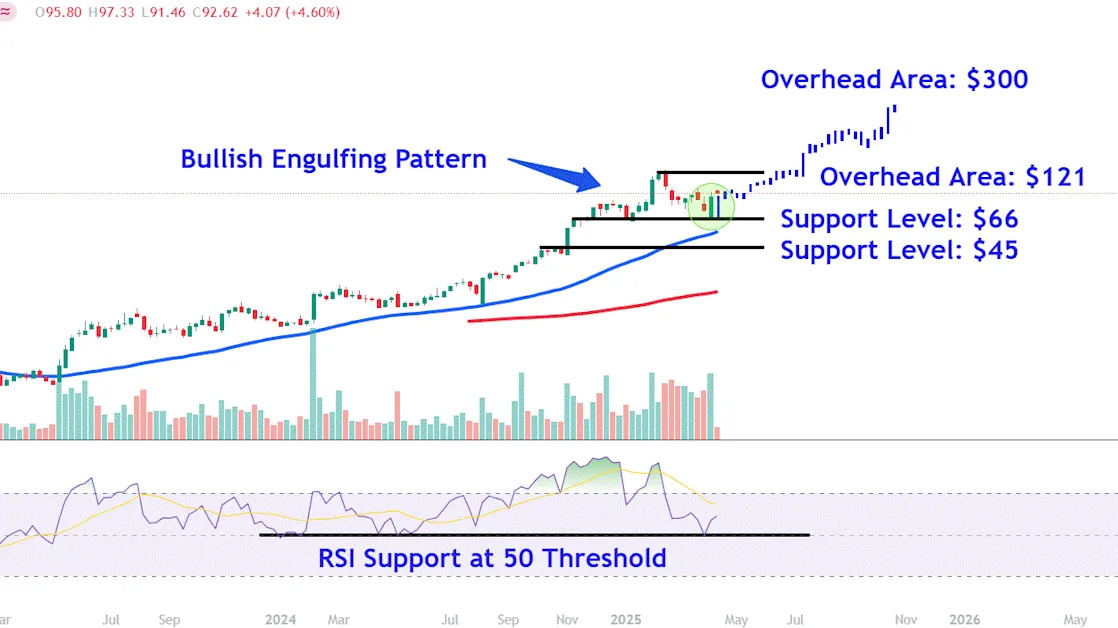
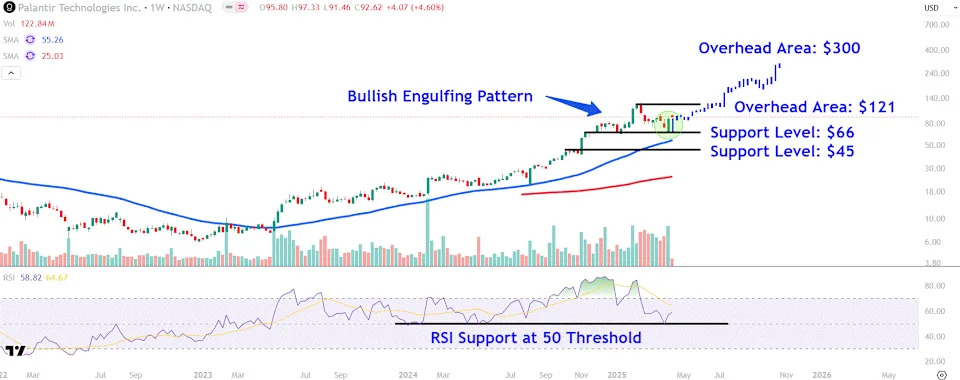
Palantir shares lost as much as 47% from their record high set in February before the stock formed a bullish engulfing pattern last week to signal a positive shift in investors sentiment.
It’s worth pointing out that the pattern coincided with the relative strength index rallying from the 50 threshold, a level that has proven to be a solid turning point during the stock’s uptrend .
Let’s identify two key overhead areas on Palantir’s chart that investors may be watching and also point out important support levels worth monitoring during periods of weakness in the stock.
Key Overhead Areas to Watch
Palantir shares gained 4.6% to close at $92.62 on Monday.
Further upside from current levels could see the shares make a move to around $121. This area on the chart would likely attract significant attention near the stock’s all-time high (ATH) and may be seen as a suitable location for profit-taking opportunities.
A move above the ATH into price discovery mode could set the stage for a longer-term rally to around $300. We projected this bullish target by applying bars pattern analysis, which takes the stock’s trend higher from August to February and overlays it from this month’s low.