Watch These Microchip Technology Levels Amid Big Swings in Stock Price
Key Takeaways
Microchip Technology ( MCHP ) shares could remain on watchlists after tumbling Thursday to lead chip stocks lower during a broad post-rally sell-off for U.S. equities .
Chip stocks such as Microchip, which makes silicon used in everything from consumer electronics to automotive systems, have remained particularly volatile against a backdrop of tariff uncertainty that has weighed heavily on consumer and business confidence , both key customers that drive chipmakers’ earnings.
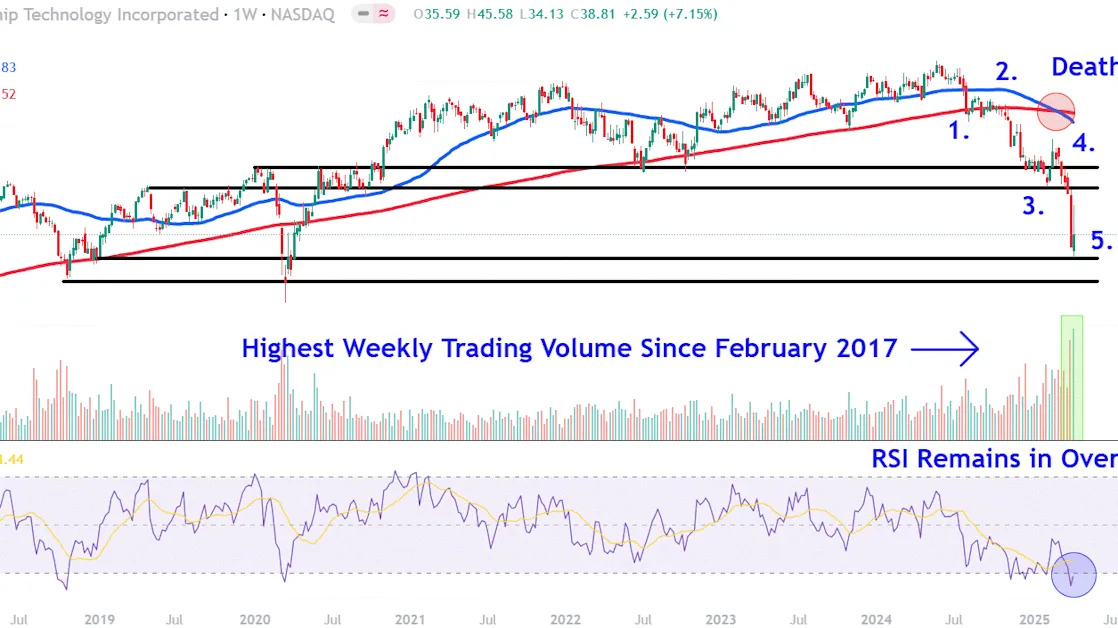
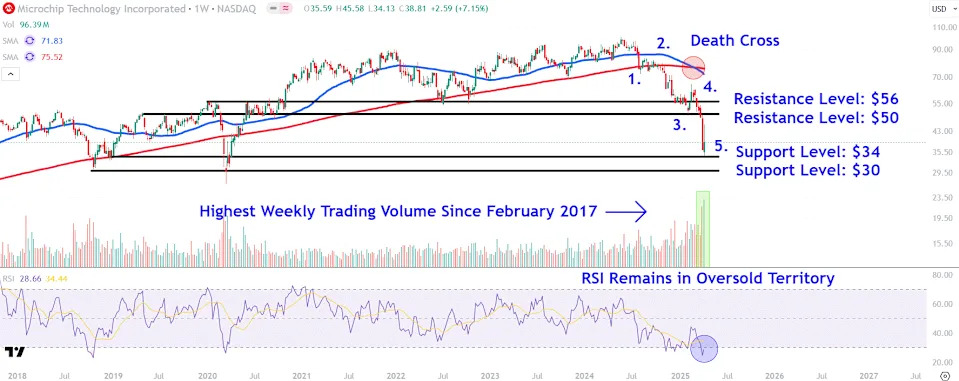
Microchip shares gave back about half of the previous session's record gains on Thursday, falling 14% to $38.81. Since the start of the year, the stock has lost around a third of its value, compared to the Nasdaq Composite's 15% drop over the same period.
Below, we analyze the technicals on Microchip’s weekly chart and identify important price levels that investors may be watching out for.
Price Swings Continue
Selling in Microchip shares has accelerated after the 50-week moving average (MA) crossed below the 200-week MA in early March to form a death cross , a chart pattern that signals lower prices.
More recently, the stock’s volatility has increased significantly since last week’s tariff-induced 25% sell-off, with sizeable swings in both directions. Importantly, this week’s price gyrations have occurred on the highest trading volume since February 2017 as investors take bets on the chipmaker’s next move.
Meanwhile, the relative strength index confirms bearish price momentum, though the indicator remains in oversold territory, potentially attracting short covering and buy-a-bounce investors.
Let’s apply t echnical analysis to identify important support and resistance levels on Microchip’s chart.
Important Support Levels to Watch
The first lower level to watch sits around $34. This area on the chart would likely attract significant attention near this week’s low, which also closely aligns with the December 2018 trough. A bounce here could indicate the completion of an Elliot Wave pattern with five price swings.
A breakdown below this area could see the shares revisit lower support at the psychological $30 level. Bargain hunters may be on the lookout for buy-and-hold opportunities in this location near the October 2018 swing low and March 2020 pandemic trough.