Traders Hunt for Elusive Market Bottom as Tariffs Crush Stocks
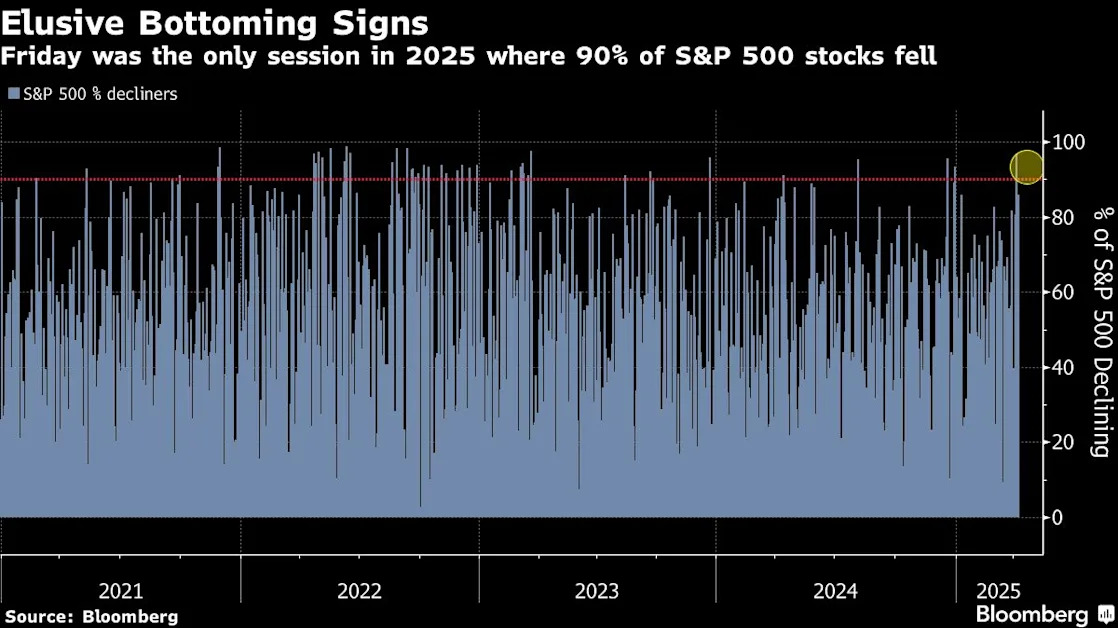
(Bloomberg) -- Traders are looking for a US stock-market bottom after the biggest four-day rout in five years, but key technical indicators suggest more pain is ahead.
Stocks are the most oversold since the depths of the pandemic, conditions that briefly lifted the S&P 500 Index by as much as 4% higher Tuesday. But the US equity benchmark erased its gains to end the session 1.6% lower at about 4,983 — teetering on the brink of a bear market — amid mounting trade tensions between the US and China. The volatility has traders scouring their charts for more guidance.
There are two crucial near-term technical levels to watch. First, there is 4,910 — the roughly 20% threshold below the S&P 500’s February peak, which provided key support late Tuesday. The gauge quickly reversed and trimmed about half of its drop in the final seven minutes of trading after touching that level.
Then there is Monday’s intraday low of 4,835, a crucial psychological threshold that — if broken — will lead to further selling, according to Mark Newton, head of technical strategy at Fundstrat Global Advisors.
“It’s hard to trust any rally,” Newton said. “Stocks are getting close to bottoming after being massively oversold, but we still haven’t seen the final low, and there’s still room to fall even further. No one knows what’s happening with tariffs.”
There are signs of support for the S&P 500 around 5,000. Goldman Sachs Group Inc. partner John Flood said this is a level where long-term investors are starting to buy the dip. “From my conversations with longer-duration investors, it feels like they will start scale buying the S&P 500 at 5,000 and get more aggressive in the mid-4,000s,” Flood wrote in a note to clients.
Technical traders are eyeing the next level of resistance around 5,119.26, the S&P 500’s Aug. 5 low when the unwinding of the yen carry trade rattled markets. After that, Dan Wantrobski technical strategist at Janney Montgomery Scott, is watching a range between 5,300 and 5,500, which would be a roughly 50% retracement of this year’s entire correction. If the S&P 500 breaches this year’s intraday low, the benchmark could fall as low as 4,650 — near the highs in July 2023, he said.
The massive daily swings continue to grip markets. On Tuesday, Wall Street’s so-called fear gauge the Cboe Volatility Index, or VIX, finished above 50, more than 140% above its 50-day moving average. It soared as high as 60 on Monday.
Of course, contrarian investors who snap up stocks when anxiety runs high consider an elevated VIX to bode well for stocks — especially when the VIX spikes upward as quickly as it did this week. But the problem is the VIX futures curve, which gives a glimpse into the short-term direction of the market, is signaling that volatility may persist for months.