Watch These Broadcom Stock Price Levels After Post-Earnings Slide
Key Takeaways
Broadcom ( AVGO ) shares fell sharply Friday, one day after the chip giant delivered results and an outlook that were largely in line with Wall Street estimates.
The company's shares hit a fresh record high this week ahead of its highly anticipated results, boosted by expectations of robust revenue growth driven by surging demand for chips that power generative AI technology.
CEO Hock Tan told analysts on the company’s earnings call that chip demand may accelerate during the second half of 2026 due to strong inference demand, referring to the process that uses a trained AI model to make predictions or decisions.
Still, Broadcom shares fell 5% to around $247 on Friday as the results and outlook may have missed the lofty expectations of investors, especially after the blockbuster results delivered by rival Nvidia last week. With today's decline, Broadcom shares are up about 6% since the start of the year, slightly outpacing the performance of the S&P 500 index over that stretch.
Let’s break down the technicals on Broadcom’s chart and identify key price levels worth watching out for.
Profit-Taking Ahead of Earnings
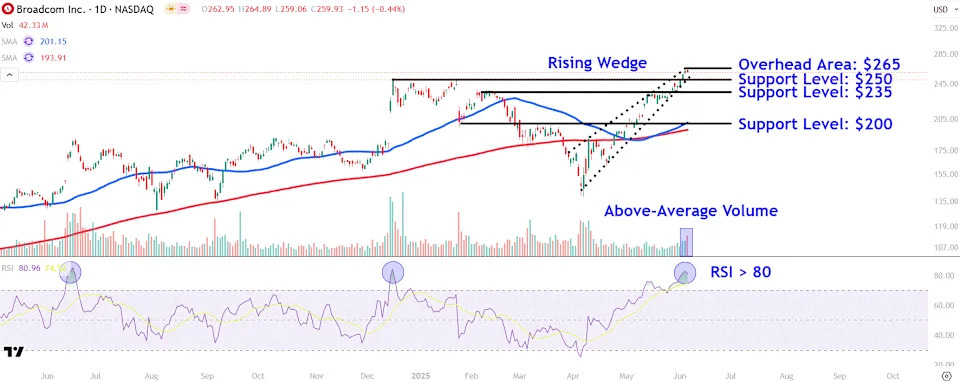
After plumbing a seven-month low in early April, Broadcom shares have trended sharply higher within a rising wedge , with the price testing the pattern’s upper trendline in recent trading sessions. However, profit-taking crept into the stock Thursday on the highest volume in around two months, which set the stage for today's selling.
It’s also worth pointing out that the relative strength index recently climbed above 80, a reading that coincided with major tops in the stock in December and June last year.
Let’s identify key support levels on Broadcom’s chart to watch amid the potential for further selling and also locate an important overhead area worth monitoring during recovery efforts in the stock.
Key Support Levels to Watch
Coming into Friday's session, the $250 level found a confluence of support from the rising wedge pattern’s lower trendline and three notable peaks that formed on the chart between December and January.