The S&P 500 Did Something in April That's Been Witnessed Only 6 Times in 75 Years -- and It Points to a Very Specific Directional Move for Stocks
May 15, 2025
Key Points
There is no shortage of ways for investors to grow their nominal wealth, including buying real estate, purchasing a Treasury bond or certificate of deposit (CD), or putting their money to work in various commodities, such as gold, silver, and oil. However, no asset class has delivered a higher average annual return over the last century than stocks.
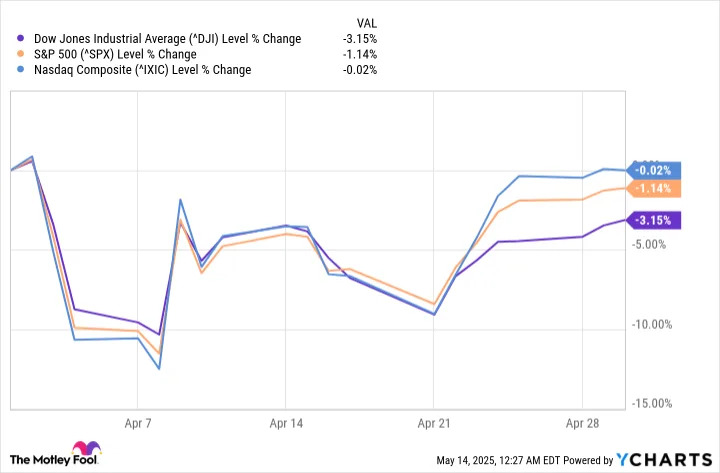
Though multidecade charts for the iconic
Dow Jones Industrial Average
(DJINDICES: ^DJI)
, broad-based
S&P 500
(SNPINDEX: ^GSPC)
, and growth-fueled
Nasdaq Composite
(NASDAQINDEX: ^IXIC)
point decisively higher, a narrower view of trading activity shows that volatility and uncertainty are perfectly normal on Wall Street.
Since the benchmark S&P 500 peaked on Feb. 19, the Dow Jones and S&P 500 both (somewhat briefly) dipped into
correction territory
. Meanwhile, the Nasdaq Composite entered its first bear market in three years.
Normally, stock market corrections and bear markets are eyebrow-raising events by themselves. But a historic bout of volatility throughout most of April is what stole the show.
Although historic volatility can, at times, be scary, one extremely unique occurrence for the S&P 500 in April
points to a clear directional move for stocks
that should have optimistic long-term investors smiling from ear to ear.
The stock market was historically volatile in April
To put into context just how wild things were for a few weeks last month, the S&P 500 logged its fifth-largest two-day percentage decline on record since 1950 (April 3 and April 4), as well as its 12th-biggest four-day percentage drop dating back 75 years (April 3 – April 8).
This short-lived stock market crash was followed on April 9 by the Dow Jones, S&P 500, and Nasdaq Composite registering their largest single-session point gains since their respective inceptions. On a percentage basis, it was the 19th-, eighth-, and second-best daily gain of all-time for the Dow, S&P 500, and Nasdaq, respectively.
This is what historic volatility looks like on Wall Street -- and it has a couple of culprits.
The initial catalyst that sent the major indexes (briefly) crashing lower was President Donald Trump's tariff policy reveal following the closing bell on April 2. At the time, Trump unveiled a 10% global tariff, along with higher "reciprocal tariffs" aimed at a few dozen countries that had traditionally run trade deficits with the U.S. It should be noted that Trump paused reciprocal tariffs for 90 days on April 9 for most countries (this was the day the Dow, S&P 500, and Nasdaq skyrocketed), as well as worked out a 90-day reciprocal tariff rate reduction with China earlier this week.
Investors crave predictability, and they're simply not getting it from this administration. Trump's propensity to shift tariff rates, implementation dates, and which products/countries are subject to tariffs has kept Wall Street on edge.
But tariffs haven't been the only whipsaw catalyst for stocks.
For instance, the stock market entered 2025 at one of its priciest valuation multiples in history, when back-tested more than 150 years. The Shiller price-to-earnings (P/E) Ratio -- also known as the cyclically adjusted P/E Ratio, or CAPE Ratio -- has averaged a multiple of 17.24 since January 1871. In December 2024, it nearly hit 39 during the current bull market cycle.
Historically, S&P 500 Shiller P/E readings above 30 have been a precursor to eventual downside of at least 20%. When volatility picks up, companies with premium valuations tend to pay the price. The problem is that these pricey businesses are often responsible for leading the stock market's charge higher.
Beyond Trump's tariffs and the historic priciness of the stock market entering 2025, investors have demonstrated concern over U.S. first-quarter gross domestic product shrinking by 0.3%, as well as Treasury bond yields rocketing higher over a short period.
A scarce move for the benchmark S&P 500 points to outsized future returns
As noted, wild gyrations in one or more of Wall Street's major stock indexes can be scary -- especially if you're a new investor who's never experienced a brief crash or whipsaw volatility before. But one of the stock market's odd quirks is that some of its biggest gains often occur within very close proximity to its largest losses.
Based on data analyzed by
Wells Fargo
Investment Institute and Bloomberg of the S&P 500's daily price changes between Feb. 1, 1994 and Jan. 31, 2024, the overwhelming majority of the index's 30 best and 30 worst days occurred within close proximity to each other -- and often during bear market declines. This is to say that steep declines in Wall Street's benchmark index have typically yielded eyepopping gains not long thereafter.
In April, the S&P 500 plunged by 10.5% from the closing bell on April 2 through the closing bell on April 4. This was its fifth-largest two-day percentage drop since 1950, and it represented only the sixth time in 75 years that the broad-based index lost at least 10% of its value over a two-day period.
With history demonstrating that the market's darkest days tend to yield its best returns, Carson Group's Chief Market Strategist Ryan Detrick plotted the future stock returns (where applicable) for the S&P 500 following these six unique double-digit, two-day percentage declines.
As you can see from Detrick's post on social media platform X, there's a solid amount of green one month later. On average, the S&P 500 has bounced back by 8.3% following all six double-digit, two-day declines.
But this pales in comparison to what the S&P 500 did one year later following the five prior two-day drops of at least 10%. The "worst" return a year later was 18%, with the average gain for the S&P 500 clocking in at 32.6%. To put this figure into context, the average annual return for the S&P 500 since 1950, according to Detrick's data set, is just 9.2%. This means the index has doubled to sextupled its average annual return following each prior two-day drop of at least 10%.
Moreover, Ryan Detrick's post hints at the disproportionate nature of stock market cycles. Though investors can become preoccupied with the possibility of a stock market correction or bear market, there's a wide variance between the length of bull and bear markets on Wall Street.
Almost two years ago, shortly after the S&P 500 was confirmed to be in a new bull market, the researchers at Bespoke Investment Group published a data set to X that calculated the calendar-day length of every S&P 500 bull and bear market since the start of the Great Depression (September 1929).
On one hand, the average S&P 500 bear market has lasted just 286 calendar days, or roughly 9.5 months. In comparison, the typical bull market has endured for 1,011 calendar days, or approximately 3.5 times as long. No matter how dire things may seem for the stock market, history has conclusively shown that being optimistic and taking the long approach is a pathway to wealth creation.
Should you invest $1,000 in S&P 500 Index right now?
Before you buy stock in S&P 500 Index, consider this:
The
Motley Fool Stock Advisor
analyst team just identified what they believe are the
10 best stocks
for investors to buy now… and S&P 500 Index wasn’t one of them. The 10 stocks that made the cut could produce monster returns in the coming years.
Consider when
Netflix
made this list on December 17, 2004... if you invested $1,000 at the time of our recommendation,
you’d have $620,719
!*
Or when
Nvidia
made this list on April 15, 2005... if you invested $1,000 at the time of our recommendation,
you’d have $829,511
!*
Now, it’s worth noting
Stock Advisor
’s total average return is
959% — a market-crushing outperformance compared to
170%
for the S&P 500. Don’t miss out on the latest top 10 list, available when you join
Stock Advisor
.
Wells Fargo is an advertising partner of Motley Fool Money.
Sean Williams
has positions in Wells Fargo. The Motley Fool has no position in any of the stocks mentioned. The Motley Fool has a
disclosure policy
.